| Original Article |
|
|
Analytical Chemistry Department, Faculty of Pharmacy, Mansoura University, Mansoura, Egypt
Corresponding Author: M. M. Salim, Analytical Chemistry Department, Faculty of Pharmacy, Mansoura University, Mansoura, Egypt. E-mail: mmasalim@yahoo.com
Running title: Kinetic spectrophotometric determination of biotin
| |
ABSTRACT |
| INTRODUCTION | |
|
|
EXPERIMENTAL |
|
|
RESULTS AND DISCUSSION |
|
|
CONCLUSION |
|
|
REFERENCES |
|
|
ABSTRACT
|
|---|
A simple accurate kinetic spectrophotometric method was developed for the determination of biotin in pure form and pharmaceutical preparations. The proposed method is based on a catalytic acceleration of biotin on the reaction between sodium azide and tri-iodide in an aqueous solution. Concentration range of 4–16 µg/mL for biotin was determined by measuring the decrease in the absorbance of tri-iodide at 348 nm by a fixed time method. The decrease in absorbance after 14 min from the initiation of the reaction was markedly correlated to the concentration with correlation coefficient of 0.9999. The detection limit (LOD) of biotin was 0.18 µg/mL while quantitation limit (LOQ) was 0.54 µg/mL. The percentage recovery of the spiked samples was 100.08 ± 0.761. The proposed procedure was successfully applied for the determination of biotin in its pharmaceutical preparations with mean recoveries of 101.17 ± 2.05 and 97.87 ± 1.50 for biotin ampoules and capsules, respectively. The results obtained were in good agreement with those obtained using official method.
KEY WORDS: biotin; sodium azide; tri-iodide; kinetic; pharmaceutical preparations|
|
INTRODUCTION |
|---|
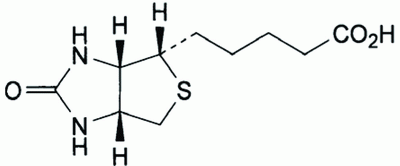
Biotin, Hexahydro-2-oxo-1H- thieno (3,4-d) imidazole -4-pentanoic acid (Fig. 1), is also known as vitamin H or Co-enzyme R (1). It is a water-soluble vitamin belonging to the B-complex. It acts as a cofactor responsible for the carbon dioxide transfer in several carboxylase enzymes. It is involved in the biosynthesis of fatty acids, gluconeogenesis, and energy production, the metabolism of the branched chain amino acids and the De Novo synthesis of purine nucleotides. Recent research indicates that biotin plays a role in gene expression and that it may act in DNA replication (2).
|
The United States Pharmacopoeia (USP) (3); recommends an acid-base titration of biotin with 0.1 N NaOH using phenolphthalein as indicator. On the other hand, the British Pharmacopoeia (BP) (4); reports a non-aqueous potentiometric titration of the studied drug with 0.1 M tetrabutylammonium hydroxide.
Various methods have been published for determination of biotin either per se or in pharmaceutical preparations including: spectrophotometry (5, 6), spectrofluorometry (7), electro-analysis (8-10) and High Performance Liquid Chromatography (HPLC) (11-17), Liquid Chromatography-Mass Spectrometry (LC-MS) (18, 19), capillary zone electrophoresis (20, 21), Microbiological methods (22), Bioassays (23), Radioisotopic binding assays (24-26) and Non-Radioisotopic binding assays (27-32).
Biotin does not manifest ultra-violet absorption spectrum for its detection (33). UV detection which is mainly employed for HPLC suffers from the low absorbance above 210 nm. This is a problem because most of the conventionally used solvents strongly absorb radiation themselves above 210 nm. Therefore, derivative and complex formation is necessary in most cases (21).
Regarding the literature review, the spectrophotometric methods which were reported for the determination of biotin, based on measurement of absorbance of tri-iodide/chloroform extract at 520 nm after oxidation with potassium iodate (5), and measurement of absorbance of tri-iodide at 350-352 nm produced after reaction with periodate (6), however, the sensitivity was rather poor, the working range was 3-18 mg/g and 20-80 mg/ml respectively. Up till now no kinetic spectrophotometric method has been reported for determination of biotin. This initiated our present study.
The catalytic kinetic spectrophotometric method is one of the most attractive approaches for determination of certain compounds and has many advantages:
The aim of the present work was to establish a simple kinetic spectrophotometric method for determination of biotin in certain pharmaceutical dosage forms, based on the catalytic effect of biotin on the tri-iodide-azide reaction which has been widely applied to the determination of compounds viz, captopril and ethamsylate (35), carbocisteine, ethionamide, thioctic acid and penicillamine (36) and glutathione and tetramethylthiuram disulphide (37).
|
|
EXPERIMENTAL |
|---|
Apparatus
A Shimadzu (Model 1601 PC) UV-Visible spectrophotometer (Shimadzu, Kyoto, Japan) was used to measure the absorbance at 348 nm. The cell chamber was kept at a specified temperature using a Shimadzu Thermostat Model T.C.C. Controller.
Reagents and materials
All reagents were of analytical grade and the water was always double distilled water.
A stock solution of biotin was prepared by dissolving 100.0 mg of biotin in 1 mL of 0.1 M NaOH and then was completed to 100 ml with distilled water. Working standard solutions were prepared by dilution with distilled water. The standard solutions were found to be stable for one week when kept in the refrigerator at 4°C.
Procedures
Construction of calibration graphs. Accurately measured aliquots of biotin working standard solution covering the working concentration range from 4-16 µg/mL, were transferred into a series of 10 mL volumetric flasks. 1 ml phosphate buffer of pH 4 was added followed by 1 mL (1.0 M) of sodium azide solution. The solutions were mixed well and diluted to 8 ml with distilled water. The solutions were kept for 3 min. Then 1ml of 0.001 M tri-iodide solution was added and the volume was adjusted to the mark with distilled water. An aliquot of the reaction solution was quickly transferred into a quartz cell within 40 sec, and then it was placed in a chamber of spectrophotometer (kept at 25°C). The absorbance of the remaining unreacted tri-iodide (A) was recorded at 348 nm versus time for 14 min. The absorbance of blank experiment (A0) was performed simultaneously. The difference in absorbance (ΔA) was plotted versus the drug concentrations (µg/mL) to get the calibration graph; alternatively, the regression equation was derived.
Procedure for the pharmaceutical preparations. An accurately weighed quantity of the mixed contents of 10 capsules or accurately measured volume of the injection solution equivalent to10.0 mg of the drug transferred into a small conical flask and extracted or diluted with 3 × 30 ml of distilled water, respectively. One milliliter of 0.1 M NaOH was firstly added. The extract was sonicated for 15 minutes and filtered if necessary into 100 ml volumetric flask. The conical flask was washed with several mLs of distilled water. The washings were passed into the same volumetric flask and completed to the mark with the same solvent. The above procedure was then followed. The nominal content was calculated either from the previously plotted calibration graph or using the corresponding regression equation.
|
|
RESULTS AND DISCUSSION |
|---|
Iodine oxidizes sodium azide in acid medium to form iodide and nitrogen.
2N3- + I2 → 3N2 + 2I-
This reaction is immeasurably slow in the absence of catalysts.
RS - + I2 → RSI + I - (38)
RSI + 2N3- → RS - + I - + 3N2
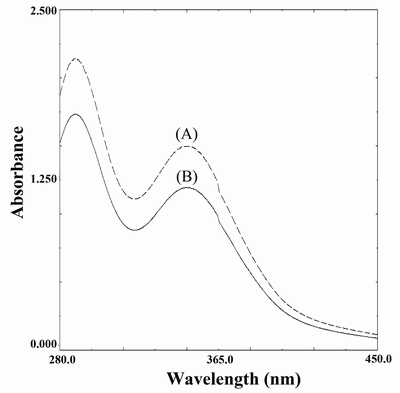
This reaction is very much accelerated in the presence of sulfide or thiol containing compounds. This reaction can be followed spectrophotometrically by monitoring the decrease in the absorbance of tri-iodide at 348 nm as shown in figure (2).
Optimization of the reaction conditions
Effect of reaction time.There are many methods, such as fixed time, initial rate and rate constant, for measuring the catalytic effects among them, the fixed time measurement is the most conventional and simplest. The most suitable reaction time was found to be 14 min after the addition of tri-iodide for biotin based on its correlation coefficient of the calibration curve as shown in Table 1.
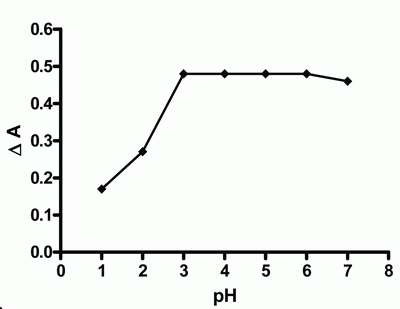
Effect of pH.The effect of pH on the catalyzed (sample) and un-catalyzed (blank) reactions was studied, using 1 mL of 0.001 M tri-iodide solution and 1 mL of 1.0 M azide solution. The maximum difference in absorbance (ΔA) was observed at phosphate buffer of pH 4 (Fig. 3). Other buffers having the same pH value such as acetate and citrate were studied and compared with phosphate buffer. Phosphate buffer was proved to be superior over acetate and citrate buffers as revealed by high sensitivity.
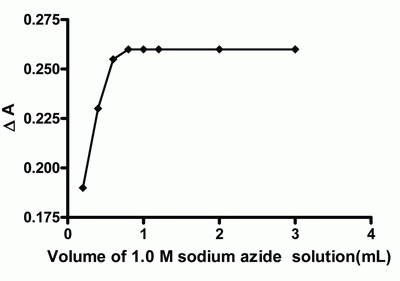
Effect of azide concentration.It was found that 1 mL (1.0 M) of sodium azide solution was sufficient to give a maximum absorbance after which the absorbance value remains constant (Fig. 4). Thus 1 mL (1.0 M) of sodium azide solution was used as optimum volume through this approach.
Effect of tri-iodide concentration.As the volume of 0.001 M tri-iodide solution increased, the net reaction rate increased. But the volumes larger than 1 mL affect the reproducibility of the proposed method due to the excessive brown colour background; so, 1 mL of 0.001 M tri-iodide is used.
Effect of temperature.The effect of temperature was studied in the range of (5-60°C). As the temperature increased, the rate of both catalyzed and un-catalyzed reactions increased up to 50°C for biotin. Above this temperature, ΔA values decreased which suggested that the rate of un-catalyzed reaction was also accelerated, or iodine became lost due to volatilization upon heating. It was found that 25°C for 14 min after addition of iodine solution has more reproducible catalytic effect.
Validation of the Method
Accuracy and precision. The proposed method was evaluated by calculating the accuracy as percent relative error (% Error) and precision as percent relative standard deviation (RSD%). The data obtained are abridged in Table (2).
Statistical analysis (40) of the results, obtained by the proposed and the official method (3) using Student’s t-test and variance ratio F-test, shows no significant difference between the performance of the two methods regarding the accuracy and precision, respectively (Table 3). The official method involved acid-base titration of biotin using 0.1 N NaOH as a titrant and phenolphthalein as indicator (3).
Concentration ranges and calibration graphs
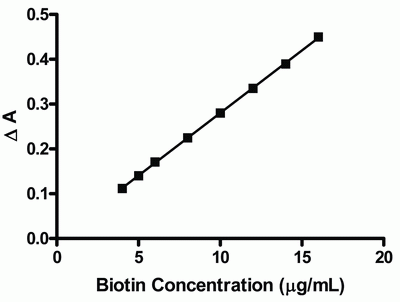
After optimizing the reaction conditions, linear calibration graph was obtained over the range of 4-16 μg/ mL. Analysis of the data gave the following regression equation:
ΔA = 1.08 × 10⁻³ + 0.0279 C (r = 0.9999)
Where is ΔA the difference in absorbance between blank and drug, C is the concentration of the drug in μg/ mL and r is the correlation coefficient. The calibration graph adopting the proposed method is shown in figure (5).
Validation of the method was evaluated by statistical analysis (40) of the regression data regarding standard deviation of the residuals (Sy/x), the standard deviation of intercept (Sa), and standard deviation of the slope (Sb). The data obtained are included in Table (2).The small values given point out to the low scattering of the points of the calibration curve.
Limit of quantitation and limit of detection
The limit of quantitation (LOQ) was determined by establishing the lowest concentration that can be measured according to ICH Q2 (R1) recommendation (39) below which the calibration graph is non linear and was found to be 0.54 μg/mL.
The limit of detection (LOD) was determined by evaluating the lowest concentration of the analyte that can be readily detected and was found to be 0.18 mg/mL. LOQ and LOD were calculated according to the following equations (39):
LOQ = 10 Sa /b
LOD = 3.3 Sa /b
Where Sa is the standard deviation of the intercept of regression line, and b is the slope of the calibration curve.
Robustness of the method
The robustness of the proposed method is demonstrated by the constancy of the ΔA with the minor changes in the experimental parameters such as pH 4 ± 0.2 and sodium azide (1.0 M) volume, (1 mL ± 0. 5). These minor changes that may take place during the experimental operation didn’t greatly affect the absorbance difference (ΔA).
Pharmaceutical Applications
The proposed method was applied to the determination of biotin in its dosage forms. The selectivity of the method was investigated by observing any interference encountered from the capsule excepients. These excepients did not interfere with the proposed method (Table 5). The results of the proposed method were statistically compared with those obtained using the official method. The latter method involved HPLC determination of biotin in its dosage forms. The liquid chromatograph is equipped with a 200 nm detector and a 4.6 mm × 15 cm column containing 3 µm packing L7. The flow rate is about 1.2 mL per minute (3).
Statistical analysis (40) of the results obtained using Student’s t-test and variance ratio F-test revealed no significant difference between the performance of the two methods regarding the accuracy and precision, respectively (Table 5).
|
|
|
|
|
|
|
|
|
|
|
CONCLUSION |
|---|
The results suggested that the observed decrease in the absorbance at 348 nm was mainly due to the catalytic effect of biotin on the reaction between iodine and azide, rather than a direct reaction between tri-iodide compounds. In conclusion, the proposed method was accurate, precise, sensitive, rapid, low cost, relatively selective and was successfully utilized in determination of biotin in its different dosage forms.
|
|
REFERENCES |
|---|