| Original Article |
|
|
1.Department of Health Statistics, The Fourth Military Medical University , Xi’an ,Shaanxi, Peoples Republic of China 2.Department of Pediatrics , Tangdu Hospital, The Fourth Military Medical University, Xi’an , Shaanxi, Peoples Republic of China 3. Institute of Public Health, Xi’an Medical University, Xi’an , Shaanxi, Peoples Republic of China
| |
ABSTRACT |
| INTRODUCTION | |
| SUBJECTS AND METHODS | |
| RESULTS | |
|
|
DISCUSSIONS |
|
|
CONCLUSION |
|
|
ACKNOWLEDGMENTS |
|
|
REFERENCES |
|
|
ABSTRACT
|
|---|
Methods: The Third Nationwide Growth Survey was performed in 1995 and from this survey, data of the Shaanxi population were retrieved to construct the age-related BMI percentile curves. A total of 27,200 healthy children aged 0~18 years were examined for height and weight, using the standardized methods. The λ-median-coefficient of variation (LMS) method was used for curve fitting; all analyses were carried out on the basis of different sexes and areas through a special program for LMS method.
Results: Median BMI increased steeply in early life, with a peak at 8 months, then declined, and then leveled off at about 6 years. The age of adiposity rebound for urban children was about two years earlier than that for rural children and one year earlier for boys than for girls. After adiposity rebound, BMI increased more rapidly in girls than in boys, and the increase in urban children was more rapid than that in rural children. As the onset of puberty, female BMI became higher than that of males, and the difference between boys and girls was larger for rural children than for urban children. The 95th ,50th and 5th percentiles for Shaanxi children were lower than those of comparable American children. Cut-off points for obesity was lower than those of international averages, suggesting the nutrition status of Shaanxi children is lower than that of children in developed countries, and has not reached the international average level.
Conclusions: Using the LMS method, we constructed age-related BMI percentile curves for Shaanxi children aged 0~18 years, the first for Chinese children. Percentile curves and cut-off points for obesity can be used as a reference for assessing the nutrition status of Shaanxi children aged 0~18 years. The identified gender and residency differences may serve as guides to an understanding of the cause and prevention of obesity.
KEY WORDS body mass index, growth reference, obesity, Chinese children
|
|
INTRODUCTION |
|---|
Obesity is a serious public health problem among children and adolescents.
It is believed to be one of the most serious nutritional problems in the world,
and has been identified as a causal factor for a variety of medical problems,
including insulin resistance, abnormal lipids and lipoproteins, elevated blood
pressure, and adults’ morbidity and mortality. Thus, obesity in childhood will
lead to a lower quality of life and higher medical costs in the future. In
recent years, early childhood obesity has risen rapidly in developing countries.
In the United States, during the past 30 years, the prevalence of overweight
[defined as body mass index(BMI, in kg/m2)≥85th percentile of NHANES
Ш] in children aged 6~11 years has increased from 15.2% to 22.3%(Troiano
et al, 1995). Among North American indigenous peoples the prevalence of obesity
of similar ages (using BMI 85th percentile of NHANES
П as a cutoff ) was 30~40% in boys and 35~43% in girls(Broussard et al,
1995). In China, the occurrence of obesity (defined as weight-to-height standard
of NCHS/CDC ,weight excess weight-for-height≥10~19% is overweight, and weight
excess weight-for-height≥20% is obesity) for children aged 0~7 years is 2.2% for
boys and 1.9% for girls and the occurrence of obesity for children aged 0~7
years is 4.2%. For children aged 7~12 years, the occurrence of obesity is about
1.5~5.5%, which is higher in urban areas and increasing rapidly. The increase in
the past ten years is about 93.4%, and the average annual increase is 9.3%(Ding
et al, 1998).
Shaanxi Province is located in the northwest of China, with a population of 35
million, of whom 35% are children and adolescents, and covers an area of 0.2
million km2. In recent years, Shaanxi has emerged as a prosperous economic and
cultural center, with a GNP of US$ 456 per capita, and a rural gross income of
US$ 167.4 per capita. The ten-year rate of increase in GNP per capita was 281%,
that of farm gross income was 250%, and all economic indices of Shaanxi are
similar to those of the other parts of the country (Shaanxi Province Health
Bureau, 1999). Compared with others, children growth and development status in
Shaanxi is at an average level (Yao,1999), which can be seen from table 1. The
development of Xi'an children ranks 15th for boys and 16th for girls among the
28 provincial capital cities of China, which the very sample region for the
Second and Third National Growth Surveys. Therefore, the physical development
status of Shaanxi children and adolescents may be representative of the country
as a whole.
| View this table: |
Table 1.Rank of 18-years-old children's development level among 28 cities in China |
| SUBJECTS
AND METHODS |
|---|

|
|
RESULTS
|
|---|
The L curves (figure 1.) measure the skewness of the BMI distribution ,a value of 1 indicates normality and values smaller than 1 representing progressively greater skewness. At birth BMI was already somewhat skewed, but during the first year when BMI rose steeply, the degree of skewness also increased sharply. Subsequently, it changed little, although the skewness of urban girls became decreased from 16 years of age. It can be seen from figure1 that the skewness for rural children was bigger than for urban children, that the skewness for girls was bigger than for boys after 2 years of age, and that the skewness for rural girls was below that of rural boys after 6 years of age. Differences between areas and sexes became greater as adolescence started. This degree of skewness was reflected in the spacing of the BMI percentiles, with the top percentile channel in the four figures wider than the bottom percentile channel at all age
|
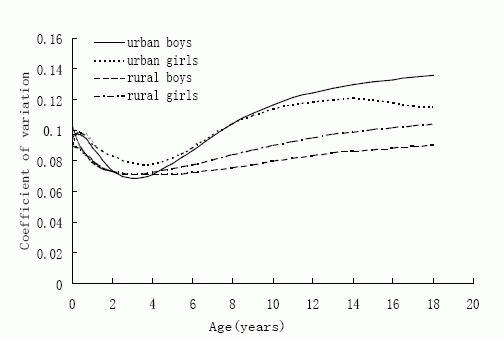
The S curve (figure 2) defines the co-efficient of variation of BMI. The
variability was about 0.10 in infancy, falling to below 0.08 and then rising to
a peak of 0.14~0.12 for urban children and rising a little for rural children in
adolescence. From figure 2 we noted that the variability among urban children
was greater than that of rural children, and from 4 years on, the variability
among rural girls was greater than that of rural boys. But the S curve for urban
boys intersected that of urban girls at about 8 years; the variability for urban
boys increased compared to that of urban girls upon adolescence, and after 16
years of age, variability among urban girls fell slightly.
View larger version : |
Fig. 2. Coefficient of variation( S curve) of BM in Shaanxi children. |
View larger version : |
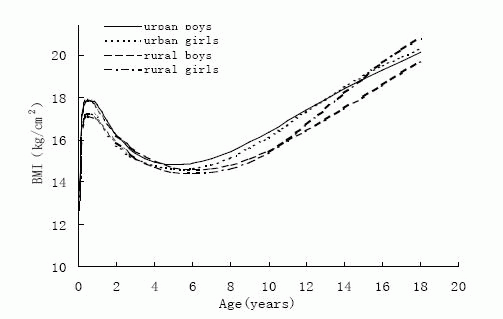
Fig. 3. Median (M curve) of BM in Shaanxi children. |
The M curve is the median of BMI. The changes in median BMI by age was on the
whole very similar in the two sexes and areas. BMI increased steeply in one’s
early life, to a peak of about 17.00kg/m2 at 8 months, then it declined, and
then leveled off at 6 years when BMI is about 14.60 kg/m2. This dip in BMI is
called adiposity rebound(Rolland et al, 1984), The age at adiposity
rebound(figure 3) for urban children was about two years earlier than for rural
children and one year earlier for boys than girls. In infancy, the median BMI
appears at the same age for the four groups. After the adiposity rebound, BMI
increased more rapidly in girls than in boys, and increased more rapidly among
urban children than their rural counterparts. Median curves for boys and girls
intersected at age thirteen for urban subjects and at age eleven for rural ones.
After the curves intersected, female BMI was higher than male, and the
difference between boys and girls was larger in rural areas than in urban areas.
At the end of puberty, rural female BMI was highest and rural male BMI was
lowest among the four groups.
View larger version : |
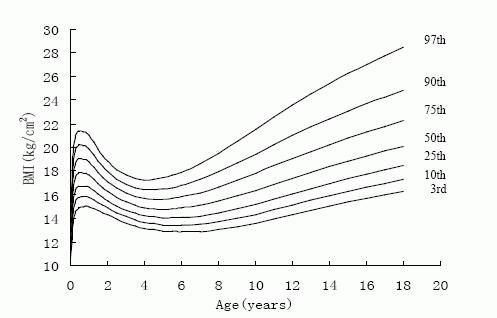
Fig. 4.The 3rd,10th,25th,50th,75th,90th,97th percentile curves of BM of urban boys in Shaanxi from 0-18 years. |
View larger version : |
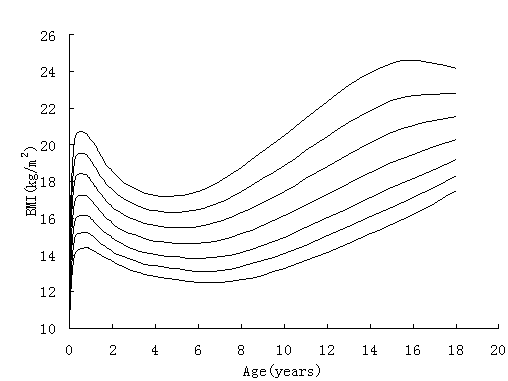
Fig.5. The 3rd,10th,25th,50th,75th,90th,97th percentile curves of BM of urban girls in Shaanxi from 0-18 years. |
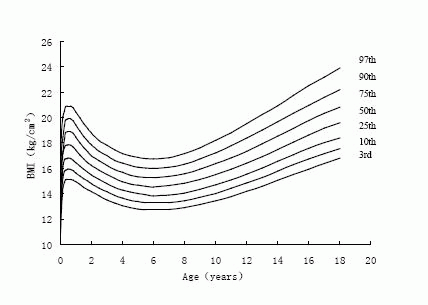
View larger version : |
Fig. 6. The 3rd,10th,25th,75th,90th,97th percentile curves of BM of rural boys in Shaanxi from 0-18 years. |
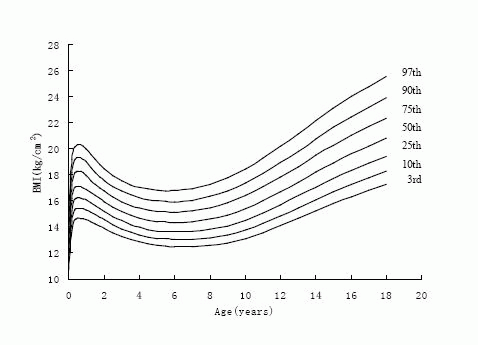
View larger version : |
Fig. 7. The 3rd,10th,25th,50th,75th,90th,97th percentile curves of BM of rural girls in Shaanxi from 0-18 years. |
Figure 4~figure 7 gives BMI reference percentile curves for each group in the
seven percentile formats. Percentiles are the conventional 3rd , 10th , 25th ,
50th , 75th , 90th and 97th . As figures showed, the shape of the percentile
curves were almost the same among the four groups, although at the end of
puberty ,urban girls upper percentile curves(97th,90th) declined after 16 years
old, which indicated there existed a subjective loss of weight among urban
girls. The age at adiposity rebound was later on the lower than the higher
curves. In infancy, all the percentiles' peak appeared at the same age. After
adiposity rebound, upper percentiles increased more rapidly and earlier than
lower percentiles. Regarding the difference between percentiles, upper
percentile differences were greater than the bottom percentile differences for
all ages, and urban group percentile differences were greater than those of
rural groups, indicating the skewness for urban groups was greater than for the
rural groups.
View this table:
Table 2. Percentage of the measurements , expressed as
SDS, falling in the 8 channels defined by the 7 percentiles. The
expected percentages based on a normal distribution are also shown
The BMI percentile curves presented in this paper are the first to be
developed for children aged 0~18 years in China. They were based on recently
collected and representative data which were taken from a national survey
conducted in 1995. They may or may not reflect the current situation in China.
The percentiles are similar in general shape to those published for French,
American and British children, but the percentiles for Shaanxi children aged
0~18 years are lower than that for American children (Refer to table 3). This
indicates the difference in percentiles between Chinese children and children in
the developed countries. The France charts were based primarily on data from
1970s(Rolland et al,1991). The American charts were based primarily on data from
NHANESl(Lawrence et al, 1991;The First National Health and Nutrition Examination
Survey, 1971 to 1974). These data showed the nutrition statues and figure of
America and France in the 1970s. Since then both childhood and adult obesity has
increased greatly(Aviva et al, 1991, Cole et al,1995). This may indicate the
nutrition status is significantly different between Chinese children and
children in developed countries.
The authors are grateful to Professor TJ Cole and Doctor Huiqi Pan for providing
the program of LMS method. We also thanks for referees and editors, Xun-zhen
Zhou(Fourth Military Medical University), Fu-ming Xu(Fourth Military Medical
University) provided valuable comments on the paper's revisions.
Table 2 shows the proportions of the data between the seven percentiles, and
there was an excess of less than 1 per 1000(3.1 per cent versus 3 per cent)
beyond the extreme percentiles, while the tails beyond Zα=±2 exactly matched the
expected sizes of 2.4 percent. It is clear that apart from random errors the
observed percentiles were close to the expected values, and the distribution was
reasonably normal.
To test the goodness of fit of the model, data were grouped at yearly intervals,
and the proportion falling below the 3 rd, 50th and 97th percentiles (that is Zα
below -1.88, 0 and 1.88 respectively) was calculated. The observed numbers
falling below the percentiles were compared with the expected numbers to produce
a χ2 statistic with 1 degree of freedom for each age and percentile group, and
the distribution of those individual χ2 statistics was examined. For urban boys
the χ2 values varied between 0 and 2.96 with a median of 0.56, and the spread of
values was compatible with a standard χ2 distribution with 1 degree of freedom.
The same was true for the rural boys, and both the urban and rural girls. The
value varied between 0 and 4.17 with a median of 0.36 for urban girls, 0 and
4.65 with a median of 0.42 for the rural boys, and 0 and 3.71 with a median of
0.18 for the rural girls. The spread of the values showed no distinct patterns
with age for either sex or areas, as showed by significance test. There was no
difference between fitted and actual distributions in each group.
![]() DISCUSSIONS
DISCUSSIONS
![]()
View this table:
Table 3 Comparison of Shaanxi children’s 95th 50th and
5th BMI percentiles with American’s
Table 4 gives the percentile and Zα for obesity by sex between 0~18 years,
defined to pass through BMI of 25 and 30 kg/m2 at age 18(Cole et al, 2000). BMI
of 25 and 30 kg/m2 are overweight and obesity cut off points for adults(WHO,
1997). As for overweight percentiles, Shaanxi was the lowest among 7 countries.
As for obesity percentiles, Shaanxi was among the three lowest, reflected that
children's overweight and obesity were related with economic status of it's
countries obviously, percentile for overweight and obesity in developed
countries were higher than that in developing countries.
View this table:
Table 4 Comparing the percentiles and Z scores for
overweight and obesity by sex between 0~18 years, defined to pass
through BMI of 25 and 30 kg/m2 at age 18 among different countries.
View this table:
Table 5 Cut-off points for BMI for overweight and
obesity by sex between 0~18 years, defined to pass through BMI of 25
and 30 kg/m2 at age 18.
From table 5 ,it can be seen that cut-off points for overweight and obesity for
Shaanxi children aged 0~18 years were lower than those for international
children (Cole et al, 2000), the cut-off point difference for obesity between
Shaanxi and international children and adolescents was greater than that for
overweight. These figures indicate Shaanxi children tend to be thinner than the
international average, but the figure distribution for the whole population is
even. Shaanxi children and adolescents' nutrition status has not reached the
international average level.
Since 1975, three large surveys on children's and adolescents' constitution and
health, growth and development have been carried out in China. Growth and
development references for Chinese children and adolescents based on these
surveys have been established, but these references are presented as or
percentile grades, and age-related percentile curves from birth to adult have
not been seen. Height for age, weight for age, weight for height,
head-circumference, chest-circumference and sitting-height are mostly involved
in these growth standards, but BMI reference has not been reported in China. We
usually use weight ratio and skinfold to assess obesity and thinness in clinical
and child health care practice, and BMI is seldom used in identifying obesity in
children and adolescents. Because China. is a developing country, a distinctive
difference in children’s nutrition and physiques exists between China and
developed countries in the world. Therefore, it is improper to use other
countries’ BMI references to assess Chinese children’s constitution and
nutrition states. Percentile curves presented in this paper based on the data
from Shaanxi can not only be used to assess nutrition statues for children aged
0~18 years in Shaanxi, it can also be used as a reference for other areas and
the whole country.
![]()
CONCLUSION ![]()
![]()
ACKNOWLEDGMENTS
![]()
![]()
REFERENCES
![]()