Received- January 4, 2011; Accepted February 21, 2011
International Journal of Biomedical Science
7(1), 62-69, Mar 15, 2011
© 2011 Master Publishing Group
Spectroflourometric and Spectrophotometric Methods for the Determination of Sitagliptin in Binary Mixture with Metformin and Ternary Mixture with Metformin and Sitagliptin Alkaline Degradation Product
Ramzia I. El-Bagary, Ehab F. Elkady, Bassam M. Ayoub
1 Department of Pharmaceutical Chemistry, Faculty of Pharmacy, Cairo University, Kasr El-Aini St., Cairo, Egypt
Corresponding Author: Bassam M. Ayoub, Department of Pharmaceutical Chemistry, Faculty of Pharmacy, Cairo University, Kasr El-Aini St., Cairo 11562, Egypt. Tel: +20125104337; Fax: +20224148452; E-mail: drbassamchemistry@hotmail.com.
|
|
ABSTRACT
 |
Simple, accurate and precise spectroflourometric and spectrophotometric methods have been developed and validated for the determination of sitagliptin phosphate monohydrate (STG) and metformin HCL (MET). Zero order, first derivative, ratio derivative spectrophotometric methods and flourometric methods have been developed. The zero order spectrophotometric method was used for the determination of STG in the range of 50-300 μg mL−1. The first derivative spectrophotometric method was used for the determination of MET in the range of 2–12 μg mL−1 and STG in the range of 50-300 μg mL−1 by measuring the peak amplitude at 246.5 nm and 275 nm, respectively. The first derivative of ratio spectra spectrophotometric method used the peak amplitudes at 232 nm and 239 nm for the determination of MET in the range of 2–12 μg mL−1. The flourometric method was used for the determination of STG in the range of 0.25-110 μg mL−1. The proposed methods used to determine each drug in binary mixture with metformin and ternary mixture with metformin and sitagliptin alkaline degradation product that is obtained after alkaline hydrolysis of sitagliptin. The results were statistically compared using one-way analysis of variance (ANOVA). The methods developed were satisfactorily applied to the analysis of the pharmaceutical formulations and proved to be specific and accurate for the quality control of the cited drugs in pharmaceutical dosage forms.
KEY WORDS:
metformin; sitagliptin phosphate; spectrophotometry; stability indicating assay; flourometry; pharmaceutical preparation
|
|
INTRODUCTION |
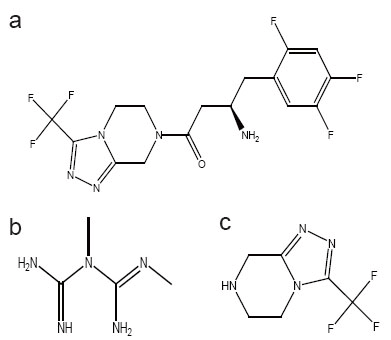
Sitagliptin (STG), [(2R)-1-(2,4,5-trifluorophenyl)-4-oxo-4-[3-(trifluoromethyl)- 5,6 dihydro [1,2,4] triazolo [4,3-a]pyrazin-7(8H)-yl] butan-2-amine] (Fig. 1a) and meformin (MET), N,N-dimethylimidodicarbonimidic diamide (Fig. 1b) are two well known hypoglycemic drugs. STG is a novel oral hypoglycemic drug of the dipeptidyl peptidase 4 inhibitor class (1). DPP-4 inhibitors represent a new therapeutic approach to the treatment of type 2 diabetes that functions to stimulate glucose-dependent insulin release and reduce glucagons levels. This is done through inhibition of the inactivation of incretins, particularly glucagon-like peptide-1 (GLP-1) and gastric inhibitory polypeptide (GIP), thereby improving glycemic control (2-4). STG is used as a single therapy or in combination with MET. MET is a biguanide drug effective in patients who lack functioning islet cells as it act by simulations of glycolysis in peripheral tissues (7, 8).
Literature survey reveals that liquid chromatographic methods have been developed for the determination of STG in biological fluids (2, 5, 6). It is worth noting that only one method has been adopted for the determination of STG in its pharmaceutical formulation. This method was based on colorimetric determination of STG after its reaction with formaldehyde and acetylacetone (1). Besides, several methods have been reported for determination of MET in pharmaceutical preparations and biological fluids including LC/MS/MS (7) and HPLC (8-11).
Spectrofluorometry has long been applied in the field of pharmaceutical analysis of many drugs (12-15) because of the higher sensitivity than is attainable in absorption spectrophotometry. A necessary condition for a compound to fluoresce is that it absorbs light in the UV or visible region of the spectrum. Accordingly, compounds that have a conjugated π- electron system may give efficient re-emission of the absorbed energy as a direct method for the determination in which the native fluorescence of the molecule is measured (12-15). On the other hand, spectrophotometry continues to be very popular, because of its simplicity and low cost so it has long been applied for the analysis of many drugs (15-21). This study presents the determination of STG and MET in binary mixture and in ternary mixture with STG degradation product, 3-(trifluoromethyl)-5,6,7,8-tetrahydro-[1,2,4]triazolo[4,3-a]pyrazine (Fig. 1c) which was prepared by degradation of STG using alkaline hydrolysis and its structure was elucidated by different spectroscopic techniques to ensure the product. It is also reported that it is the synthetic intermediate of STG (22) and it is the active metabolite of the drug (23).
|
|
EXPERIMENTAL |
Instrumentation
A Jenway 6800 double beam ultraviolet/visible spectrometer, U.K., connected to an IBM compatible computer with 1-cm quartz cell and supported with Jenway flight deck software was used. BIO-TEK spectrofluorometer, Italy, SFM 25 was used.
Reagents and reference samples
Pharmaceutical grade sitagliptin phosphate monohydrate, certified to contain 99.80%, Januvia® tablets nominally containing 128.5 mg of sitagliptin phosphate monohydrate per tablet (batch no. S0273) and Janumet® tablets nominally containing 64.25 mg of sitagliptin phosphate monohydrate and 1000 mg of metformin per tablet (batch no. 0426570) were kindly supplied from Merck Sharp and Dohme Co. (Cairo, Egypt). pharmaceutical grade metformin hydrochloride, certified to contain 99.79% was kindly supplied by Chemical Industries Development (Cid) Co. (Giza, Egypt). Standard stock solutions of each drug (1 mg/ml) were prepared by dissolving 100 mg of the drug in methanol and completing the volume to 100 ml in a volumetric flask and then the required concentrations were prepared by serial dilution. All the solvents used were of analytical grade.
Preparation of alkaline degradation product. An amount of 1 g of STG bulk powder was dissolved in 250 ml of 5N aqueous sodium hydroxide and the solution was refluxed for 6 hours on a boiling water bath, cooled and neutralized by 5N aqueous hydrochloric acid. The formed precipitate was filtered, washed several times and dried. Complete degradation was confirmed using TLC plates and its structure was elucidated by different spectroscopic techniques.
General procedures and calibration graphs
Flourometric method. Aliquots from STG stock standard solution equivalent to 2.5-1100 μg were accurately measured and transferred into a set of 10 mL volumetric flasks and the volumes were completed with methanol. The relative fluorescence intensity was measured at the specified excitation and emission wavelengths (λem at 575 nm with λex at 263 nm), then plottedagainst its corresponding concentration and the regressionparameters were computed.
Zero order spectrophotometric method. Aliquots from STG stock standard solution equivalent to 0.5-3 mg were accurately measured and transferred into sets of 10 mL volumetric flasks and the volumes were completed with methanol. The zero order absorption spectraof each solution was recorded against methanol as a blank at 267 nm, then plottedagainst its corresponding concentration and the regressionparameters were computed.
First derivative spectrophotometric method. Aliquots from MET and STG stock standard solutionsequivalent to 20-120 μg and 0.5-3 mg, respectively,were accurately measured and transferred into two separatesets of 10 mL volumetric flasks and the volumes were completedwith methanol. The zero order absorption spectraof each solution was recorded against methanol as a blank,then the first derivative spectra were computed applying scalingfactor of 10. The amplitudes at 246.5 nm and 275 nm were measured for MET and STG, respectively, then plotted against corresponding concentrations and the regressionparameters were computed.
Derivative ratio spectrophotometric method. The previously scanned zero order absorption spectra of MET were divided by the spectrum of STG (50 μg mL−1) which is the chosen divisor. The first derivative of the obtained ratio spectra was computed. Two calibration curves were constructed relating the amplitudes at 232 nm and 239 nm to the corresponding concentrations of MET.
Assay of laboratory-prepared mixtures. The absorption spectrum was recorded for the laboratory prepared mixtures, against methanol as a blank. The zero order absorption spectraat 267 nm was used for the direct determination of STG. The amplitudes of the first derivative spectra of the laboratory prepared mixtures containing different ratios of MET and STG were measured at 246.5 nm and 275 nm for MET and STG, respectively. The concentrations of MET and STG were calculated from their corresponding regression equations. The previously scanned zero order absorption spectra for the laboratory prepared mixture were divided by the spectrum of STG (50 μg mL−1).
For the spectroflourometric part, the relative fluorescence intensity of STG in the laboratory prepared mixtures was measured at the specified excitation and emission wavelengths (λem at 575 nm with λex at 263 nm).
Assay of Januvia® and Janumet® tablets. Twenty tablets of each drug were weighed and the coats were removed by carefully rubbing with a clean tissue wetted with methanol. An accuratelyweighed amount of the finely powdered Januvia® and Janumet® tabletsequivalent to 100 mg of STG were separately made up to100 ml with the selected solvent, the solution was filtered followed by serial dilution to the required concentration for each experiment. The procedure was continued as mentioned under general procedures and calibration.
|
|
RESULTS AND DISCUSSION |
Literature survey reveals that only liquid chromatographic methods have been developed for the determination of STG in biological fluids (2, 5, 6). The development of spectrophotometric and spectrofluorometric methods for the determination of STG either in binary mixture with MET or ternary mixture with MET and STG alkaline degradation product was of interest as no such methods have been reported for these mixtures.
STG alkaline degradation product (Fig. 1c) has been prepared using alkaline hydrolysis of the amide bond of the intact drug. Complete degradation was confirmed using TLC plates. Structure elucidation of the obtained secondary amine was confirmed using different spectroscopic techniques. I.R. spectrum showed the absence of the characteristic peak of the carbonyl group at 1639 cm-1. UV spectroscopy showed that the absence of the characteristic maximum of intact STG at 267 nm. Then Mass spectroscopy confirmed the hydrolyzed product showing the molecular weight of the obtained structure at 192.
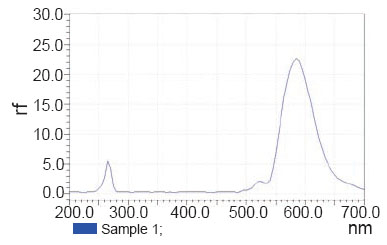
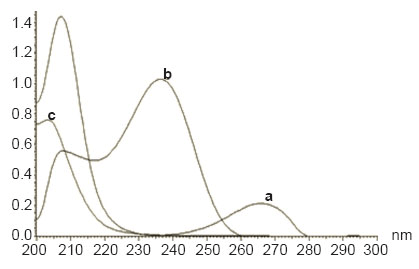
STG could be determined using flourometry (Fig. 2) and zero order spectrophotometry (Fig. 3) without interference from MET or STG alkaline degradation product. The characteristic parameters of the regression equations are given in Table 1 and Table 2. MET could not be determined by the previously mentioned methods as its absorption spectrum exhibits overlap from that of STG (Fig. 3) and it does not have any native fluorescence. First derivative, ratio derivative spectrophotometric methods have been applied to allow the resolution of the two drugs. MET was successfully determined in the presence of STG and STG degradation product.
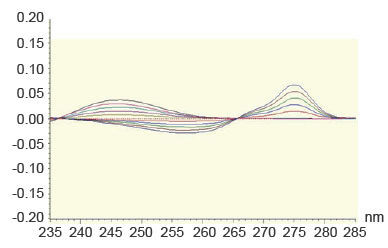
Direct UV-absorbance measurement is subject to interference from excepients and degradation products. Among the techniques used to eliminate such interference is derivative spectrophotometry. Derivative spectrophotometry is a well established technique for the assay of drugs in mixtures and in pharmaceutical dosage forms enhancing the resolution of overlapping bands. It can be applied for the determination of a drug in the presence of another by selecting a wavelength where contribution of one compound is almost zero while the compound to be determined has a reasonable value, so it has been used in the determination of many drugs (15-21). First derivative technique showed that both MET and STG could be determined by measuring the amplitude at 246.5 nm and 275 nm, respectively (Fig. 4). A linear correlation was obtained between the amplitude values and the corresponding concentrations for both drugs at their corresponding wavelengths. The characteristic parameters of the regression equation of the first derivative method for the determination of MET and STG are given in Table 3.
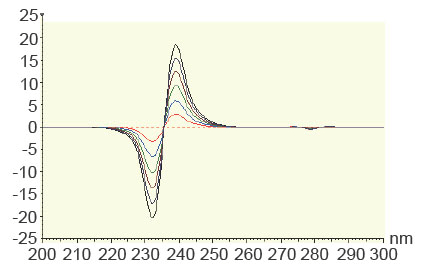
Another method for resolving interferences between overlapping spectra is the derivative ratio spectrophotometry method (20, 21). The absorption spectrum of the mixture is obtained and divided by the absorption spectrum of a standard solution of one of the components and then the first derivative of the ratio spectrum is obtained. MET has been determined in the concentration range of 2-12 μg/ml using the spectrum of 50 μg/ml of STG as a divisor using methanol as a blank. In order to optimize the ratio derivative method that was developed, the influence of different variables was studied. These variables included divisor concentrationand smoothing factor. The careful choice of the divisor and the working wavelengths were of great importance, so ten different concentrations of STG (10, 20, 30, … and 100 μg mL−1) were tried as divisors. It was found that minimum noise and better selectivity were obtained upon using 50 μg mL−1 of STG spectrum as a divisor. Two calibration curves were constructed at 232 nm and 239 nm, representing the relationship between the amplitudes and the corresponding concentrations (Figure 5). The characteristic parameters of the regression equation of the ratio derivative method for the determination of MET are given in Table 4.
View larger version :
[in a new window] |
Figure 1. Chemical structures of sitagliptin (a), metformin (b) and sitagliptin alkaline degradation product (c).
|
|
View larger version :
[in a new window] |
Figure 2. Excitation and emission spectra of sitagliptin (55 μg ml-1).
|
|
View larger version :
[in a new window] |
Figure 3. Zero order spectra of sitagliptin 50 μg ml-1 (a), metformin 10 μg ml-1 (b) and sitagliptin degradation product 50 μg ml-1 (c).
|
|
View larger version :
[in a new window] |
Figure 4. First order spectra of sitagliptin (50 to 250) μg ml-1 at 275 nm and metformin (2 to10) μg ml-1 at 246.5 nm.
|
|
View larger version :
[in a new window] |
Figure 5. First derivative of ratio spectra of metformin hydrochloride 2-12 μg/ml using the spectrum of 50 μg/ml of STG as a divisor, methanol was used as a blank.
|
|
|
|
QUANTIFICATION, ACCURACY AND PRECISION |
Standard calibration curves were prepared by separately preparing series of different concentrations of the two drugs and applying the suggested procedures. The linearity of the calibration curves were validated by the high value of correlation coefficients. The analytical data of the calibration curves including standard deviations for the slope and intercept (Sb, Sa) are summarized in Tables 1-4. The regression equations of these calibration graphs were utilized for the determination of concentrations of the cited drugs in laboratory prepared mixtures and tablets. The reproducibility and accuracy of the suggested methods were assessed using different laboratory prepared solutions of different concentrations and determination of the concentrations in tablets. The results obtained were of good accuracy and precision. The applicability of the procedures for estimation of tablets was validated using standard addition technique as a check for accuracy (Tables 1-4).
A statistical analysis of the results obtained by the proposed methods for the determination of STG and MET was carried out by “SPSS statistical package version 11”. The significant difference between groups was tested by one way ANOVA (F-test) at p=0.05 as shown in Tables 5-7. The test ascertained that there was no significant difference among the methods.
View this table:
[in a new window]
|
Table 1. Results obtained by the proposed flourometric method for the determination of sitagliptin
| |
View this table:
[in a new window]
|
Table 2. Results obtained by zero order method for the determination of sitagliptin
| |
View this table:
[in a new window]
|
Table 3. Results obtained by first derivative method for the determination of sitagliptin and metformin in mixture
| |
View this table:
[in a new window]
|
Table 4. Results obtained by ratio derivative method for the determination of metformin in mixture
| |
View this table:
[in a new window]
|
Table 5. Statistical comparison between the results of the flourometric methods and the reference methods for the determination of sitagliptin
| |
View this table:
[in a new window]
|
Table 6. Statistical comparison between the results of the spectrophotometric methods and the reference method for the determination of sitagliptin
| |
View this table:
[in a new window]
|
Table 7. Statistical comparison between the results of the spectrophotometric methods and the refernce methods for the determination of MET in binary mixture with sitagliptin
| |
|
|
CONCLUSION |
The proposed methods have the advantages of simplicity, precision, accuracy and convenience for the quantitation of binary mixture of STG and MET in dosage form as well as ternary mixture of STG with MET and STG alkaline degradation product. The flourometric method was of higher sensitivity. Hence, the proposed methods can be used for the quality control of the cited drugs and can be extended for routine analysis of the drugs in their pharmaceutical preparations.
|
|
REFERENCES |
- Sekaran B, Rani P. Development and validation of spectrophotometric method for the determination of DPP4 inhibitor, Sitagliptin in its pharmaceutical dosage forms. Int. J. Pharm. Sci. 2010; 2 (4): 138.
- Nirogi R, Kandikere V, Mudigonda K, et al. Sensitive liquid chromatography tandem mass spectrometry method for the quantification of sitagliptin, a DPP-4 inhibitor, in human plasma using liquid liquid extraction. Biomed. Chromatogr. 2008; 22: 214.
- Dhillon S. Sitagliptin. A review of its use in the management of type 2 diabetes mellitus. Drugs. 2010; 70 (4): 489.
- Green J, Feinglos M. New combination treatments in the management of diabetes: focus on sitagliptin-metformin. Vasc. Health Risk Manag. 2008; 4 (4): 743.
- Zeng W, Musson D, Fisher A, et al. Determination of sitagliptin in human urine and hemodialysate using turbulent flow online extraction and tendem mass spectrophotometry. J. Pharmaceut Biomed. Anal. 2008; 46: 534.
- Zeng W, Xu Y, Constanzer M, Woolf EJ. Determination of sitagliptinin human plasma using protein precipitation and tandem mass spectrometry. J. Chromatogr B Analyt Technol Biomed. Life Sci. 2010; 878 (21): 1817.
- Sengupta P, Bhaumik U, Ghosh A, et al. Chatterjee B. Bose A. Pal TK, LC-MS-MS development and validation for simultaneous quantitation of metformin, glimepiride and pioglitazone in human plasma and its application to a bioequivalence study. Chromatographia. 2009; 69 (11-12): 1243.
- Xiong Y, Zhou HJ, Zhang ZJ. A chemiluminescence sensor for determination of metformin in urine samples based on molecularly imprinted polymer. Fenxi Shiyanshi. 2006; 25 (3): 5.
- Ali AR, Duraidi II, Saket MM, et al. Column high-performance liquid chromatographic method for the simultaneous determination of rosiglitazone and metformin in a pharmaceutical preparation. J. AOAC Int. 2009; 92 (1): 119.
- Porta V, Schramm SG, Kano EK, et al. HPLC-UV determination of metformin in human plasma for application in pharmacokinetics and bioequivalence studies. J. Pharm. Biomed. Anal. 2008; 46 (1): 143.
- Zhong LH, Ling X, Sun H. HPLC/MS2 detection of biguanides and sulfonylurea antidiabetics illegally mixed into traditional Chinese preparations. Yaowu Fenxi Zazhi. 2008; 28 (10): 1683.
- EL-Ashry S, EL-Sherbeny M, EL-Sherbeny D, et al. Fluorimetric determination of some thioxanthene derivatives in dosage forms and biological fluids. J. Pharm. Biomed. Anal. 2000; 22 (5): 729.
- Rizk M, Belal F, Ibrahim F, et al. Spectrofluorimetric analysis of certain 4-quinolone in pharmaceuticals and biological fluids. Pharmaceutica Acta Helvetiae. 2000; 74 (4): 371.
- Belal F, Ibrahim F, Hassan SM, et al. Spectroflourimetric determination of some pharmaceutically important thioxanthene derivatives. Analytica Chimica Acta. 1991; 255 (1): 103.
- Bebawy L, Abbas S, Fattah L, Refaat H. Application of first derivative, ratio derivative spectrophotometry, TLC-densitometry and spectrofluorimetry for the simultaneous determination of telmisartan and hydrochlorothiazide in pharmaceutical dosage forms and plasma. Il Farmaco. 2005; 60 (10): 859.
- Toral MI, Pope S, Quintanilla S, et al. Simultaneous determination of amiloride and furosemide in pharmaceutical formulations by first digital derivative spectrophotometry.Interl. J. Pharm. 2002; 249 (2): 117.
- Abbaspour A, Mirzajani R. Simultaneous determination of phenytoin, barbital and caffeine in pharmaceuticals by absorption (zero-order) UV spectra and first-order derivative spectra multivariate calibration methods. J. Pharm. Biomed. Anal. 2005;38 (3): 420.
- Satana E, Altinay S, Goger N, et al. Simultaneous determination of valsartan and hydrochlorothiazide in tablets by first derivative ultraviolet spectrophotometry and LC. J. Pharm. Biomed. Anal. 2001; 25 (6): 1009.
- Gadila S, Batchu S, Lade S. Development and Validation of liquid chromatographic and UV derivative spectrophotometric methods for the determination of famciclovir in pharmaceutical dosage forms. Chem. Pharm. Bull. 2006; 54 (6): 819.
- Bebawy LI. Application of TLC-densitometry, first derivative UV-spectrophotometry and ratio derivative spectrophotometry for the determination of dorzolamide hydrochloride and timolol maleate. J. Pharm. Biomed. Anal. 2002; 27 (5): 737.
- Altinoz S, Toptan S. Simultaneous determination of Indigotin and Ponceau-4R in food samples by using Vierordt's method, ratio spectra first order derivative and derivative UV spectrophotometry. J. Fd. Comp. Anal. 2003; (16) 4: 517.
- Hansen K, Balsells J, Dreher S, et al. First Generation Process for the Preparation of the DPP-IV Inhibitor Sitagliptin. Org. Process Res. Dev. ACS. 2005; 9 (5): 634.
- Gallwitz B. Review of sitagliptin phosphate: a novel treatment for type 2 diabetes. Vasc health risk manag. 2007; 3 (2): 203.
- The Indian Pharmacopoeia. 4th ed. New Delhi: The Controller of Publications. 1996; 1: 469.